
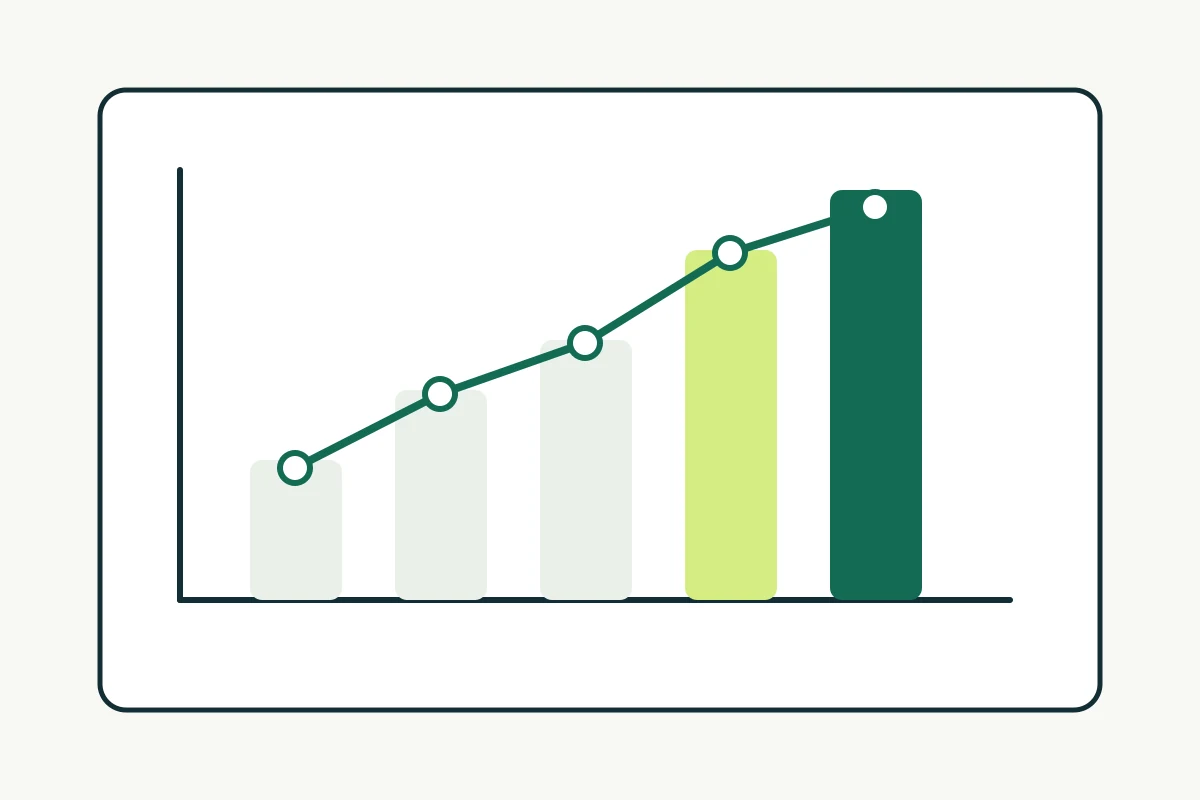
What site and time period does this case study cover?
The subject is b2bseoservices.co.uk, our own B2B SEO site. The connected Google Search Console property has dated rows from 7 October 2026. The last date in this reported window is 9 November, which makes this a 34-day snapshot, including the zero-impression starting day. The 60-day follow-up window ends on 5 December.
All figures below come from the property's Search results performance data with date as the dimension, queried on 12 November 2026 for 7 October–9 November. They are Google Search observations, not analytics sessions or customer enquiries. Google defines an impression as an eligible appearance of a link in search results, a click as a visit from that result, and average position as an impression-weighted position measure. A link can receive an impression with no click.
What was the baseline?
The first dated row, 7 October, recorded zero impressions and clicks. The first seven days with impressions, 8–14 October, produced 2,023 impressions, zero clicks and an impression-weighted average position of 81.5. That is a starting observation, not proof that the site had no earlier marketing activity or no pages indexed before 7 October.
No credible qualified-lead or revenue baseline was supplied with this export. We therefore cannot calculate pipeline return or claim that search created sales. The case-study measurement guide explains the difference between visibility and commercial outcomes.
What changed in the available Search Console data?
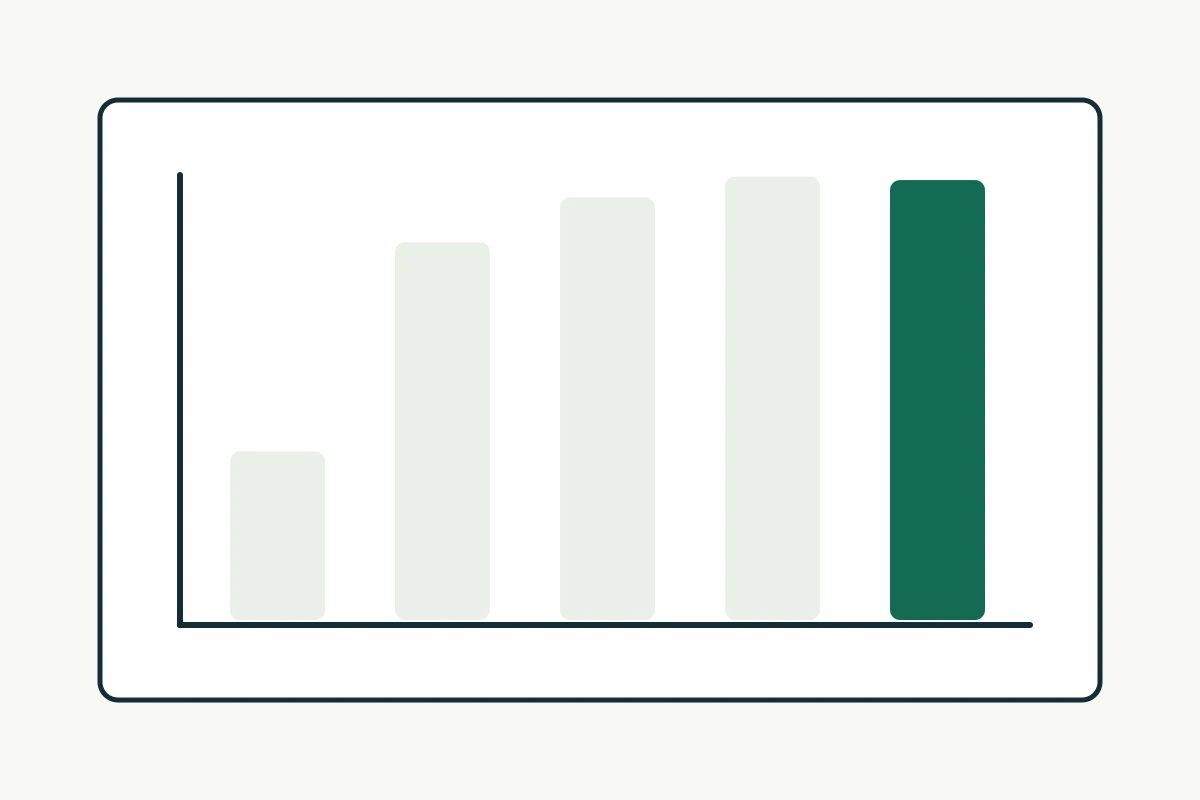
Visibility expanded quickly while clicks remained scarce. Across the 34 dated rows, the property recorded 22,230 impressions, eight clicks and an overall impression-weighted average position of 63.5. The click-through rate was about 0.036%. Most impressions came from positions far from the first results page, which helps explain the low click count.
| Period | Impressions | Clicks | Average position* |
|---|---|---|---|
| 8–14 Oct | 2,023 | 0 | 81.5 |
| 15–21 Oct | 4,533 | 1 | 78.7 |
| 22–28 Oct | 5,073 | 1 | 64.7 |
| 29 Oct–4 Nov | 5,322 | 3 | 52.2 |
| 5–9 Nov, five days | 5,279 | 3 | 54.0 |
| 8 Oct–9 Nov | 22,230 | 8 | 63.5 |
Average position is weighted by each day's impressions within the selected property-level Search Console export. The last row covers five days, so its impressions should not be compared with a full seven-day row without adjustment.
The first week with impressions averaged position 81.5; the 29 October–4 November week averaged 52.2. A lower number means the recorded results appeared higher on average, but this is not a fixed-keyword ranking comparison. The query mix and the pages shown can change as a site gains coverage. We would need a stable query cohort to say that the same terms moved by that amount.
Where did the clicks come from?
The same period's country breakdown recorded six clicks from the United Kingdom and two from Pakistan. The country table showed 20,514 UK impressions and 29 Pakistan impressions. That means the majority of impressions were in the target market, while a quarter of the small click total came from outside it. Eight clicks are too few to call this a reliable lead signal.
At page level, the B2B content marketing service page recorded three clicks and 1,454 impressions; the case-study measurement guide recorded two clicks and 15 impressions. Other clicked URLs included the B2B SEO services page, contact page and one case-study page, each with one click in the returned page table. These early UK market signals are limited by the small click count. Page-level and property-level impression totals use different aggregation rules, so we do not sum page rows to reproduce the property total.
What work can we responsibly connect to these results?
The site has published service pages, guides, internal links, structured data and a sitemap during this period. Those are observable features of the site, but this Search Console export does not isolate their individual effects. It also does not show which impression came from a particular release. The defensible statement is that Google began showing more URLs for more searches while the site was being built.
Search Console records the result, not its cause. We cannot infer that every impression came from a new blog post, that a title edit created a click, or that the site's content generated qualified enquiries. To test an individual change, we would need the release date, affected URL cohort, a comparison period and a way to account for other changes.
What appears to be working?
The strongest early signal is coverage: the site moved from 34 impressions on 8 October to 1,247 on 9 November. The rise is visible in the daily property data, and UK searches account for most recorded impressions. Service pages appearing in the clicked-URL list is encouraging because those pages can support enquiries, but the volume is still too small for a conversion claim.
The position distribution also shows the limitation. An average position around 52–54 in the later weeks is better than an average above 80 in the earliest week, yet still far from consistent first-page visibility. More impressions did not translate into many visits.
What did not work yet?
Clicks remained at eight for the whole interim period. There is no supplied evidence of qualified enquiries, opportunities or revenue from those clicks. A site can have 22,230 impressions and still have no proven commercial return. We would rather show that gap than imply that impressions are sales.
The country breakdown shows some off-market activity. That is not automatically a targeting failure: Search Console includes every country where the property appeared. It does mean that any future case study should report UK results separately, and a CRM should identify whether incoming firms match the intended buyer profile.
What would make the 60-day case study stronger?
The planned 60-day update should include a stable 7 October–5 December window, weekly property totals, UK-only totals, top pages, query groups and any available conversion records. Query groups should distinguish commercial supplier searches from definitions and broad research. Each chart should name its source and denominator.
| Evidence | What it can support | What it cannot prove alone |
|---|---|---|
| Search Console impressions | Visibility in Google results | Visits or qualified demand |
| Search Console clicks | Visits from Google search results | Leads or sales |
| Average position | Position of the observed query mix | Rank movement for a fixed term set |
| Country breakdown | Where results appeared and clicks occurred | Buyer location or company fit |
| CRM opportunity record | Whether a lead became a qualified opportunity | Sole credit for SEO without attribution context |
We will keep the method reproducible: date range, property, dimensions, export date and calculation rules should accompany the final chart. Google's performance-report guidance explains why query, page and property totals can differ. A reader should be able to understand those limits before comparing this site with another B2B business.
What should another B2B team take from this early data?
Early impressions show that Google is testing and displaying a site's pages, but they are only the first layer of evidence. Watch whether relevant commercial pages gain UK impressions, whether those impressions become clicks, and whether visitors become qualified conversations. The B2B SEO timeline guide puts this early window in context without promising a fixed month for results.
For a broader view of our published work and its evidence, read the case studies. This own-site report will be updated with the complete 60-day export after 5 December 2026.