
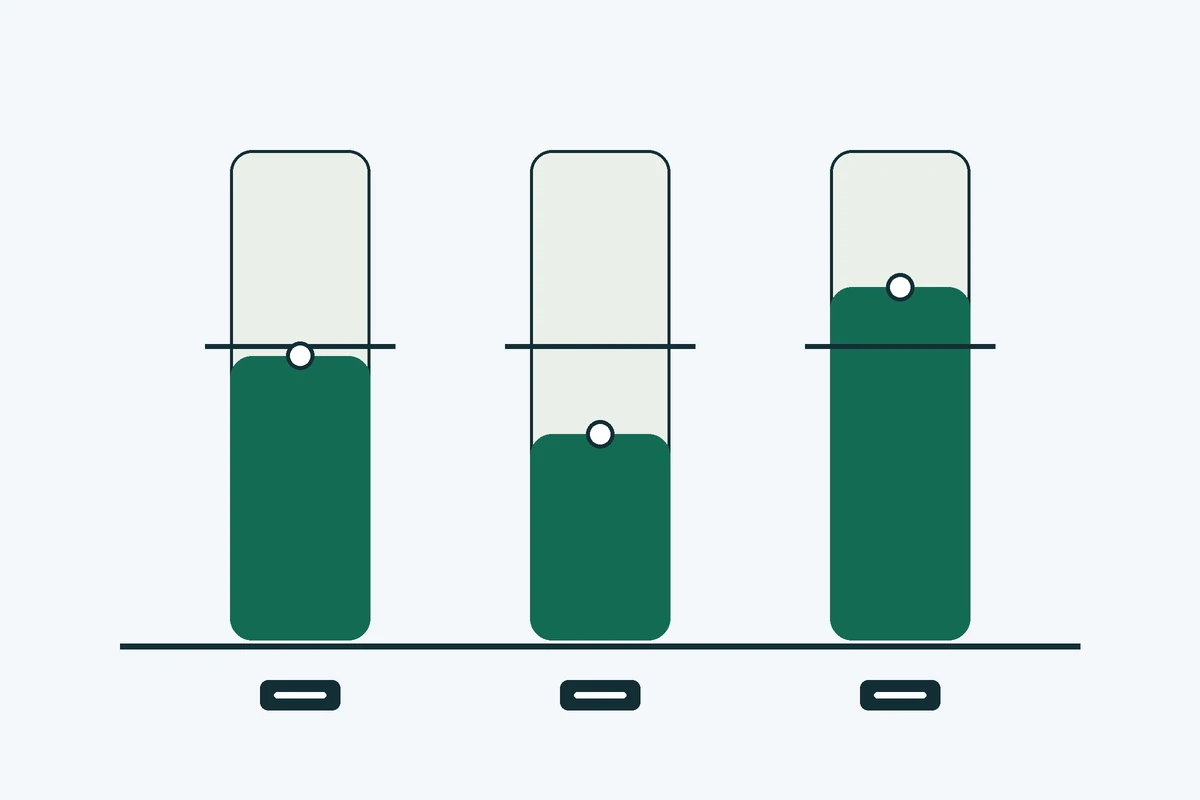
Core Web Vitals are three Google metrics: Largest Contentful Paint (LCP) for loading, Interaction to Next Paint (INP) for responsiveness, and Cumulative Layout Shift (CLS) for visual stability. A page passes when real visits meet 2.5 seconds for LCP, 200 milliseconds for INP and 0.1 for CLS, measured at the 75th percentile.
For a B2B site, the work that pays is rarely page by page. Service, industry and case study pages are usually built from a handful of shared templates, so one template fix reaches many URLs at once. The homepage is often the page that passes. The pages that fail tend to be the ones a buyer reaches during evaluation.
What are Core Web Vitals?
Core Web Vitals are the subset of Google's web vital metrics that apply to every web page. Each one measures a different part of the visitor's experience, and each needs a different fix.
The three metrics
LCP measures loading. It records how long the largest visible element on the page takes to appear after the page starts loading. On many B2B pages that element is a hero image, a headline block or a video poster.
INP measures responsiveness. It records how long the page takes to respond to a visitor's clicks, taps and key presses. INP replaced First Input Delay (FID) as the responsiveness metric. Web.dev reports that INP became a stable Core Web Vital in 2024.
CLS measures visual stability. It records how much visible content moves unexpectedly while the page loads. A form that jumps down the page because a banner loaded above it is a common example.
What are the current thresholds?
Google sorts each metric into good, needs improvement or poor. The table gives the boundaries that web.dev publishes.
| Metric | Good | Poor |
|---|---|---|
| Largest Contentful Paint (LCP) | 2.5 seconds or less | Above 4.0 seconds |
| Interaction to Next Paint (INP) | 200 milliseconds or less | Above 500 milliseconds |
| Cumulative Layout Shift (CLS) | 0.1 or less | Above 0.25 |
Anything between the good and poor boundaries sits in the needs improvement band.
Why the 75th percentile matters
Google does not judge a page on its average visit. It uses the 75th percentile of page views, so three quarters of real visits must meet the good threshold for a metric to pass. Web.dev states that if at least 25 percent of page views fall in the poor range, the site is classed as poor for that metric.
This rule explains most surprises. A page can look fast on one device and still fail, because the slowest quarter of visits decides the result.
Is INP the same as FID?
No. First Input Delay measured only the delay before the browser began to handle the first interaction. INP looks across the visit at how the page responds to interactions, so it catches slow handlers that FID missed. For B2B sites this matters on forms, quote calculators and navigation menus, where a visitor may click several times before the page responds.
Does Core Web Vitals affect rankings?
Yes, in the sense that Google uses them in its ranking systems. Google's own page on the subject says Core Web Vitals "are used by our ranking systems", and it recommends that site owners achieve good scores for success in Search. The same page is clear about the limits: a good score does not guarantee that a page ranks at the top, and there is more to page experience than these three metrics.
Google does not publish how much weight the metrics carry. Treat them as a quality floor that a page needs to meet, not as a lever that outranks weak content. For a B2B buyer, the more immediate cost of a slow page is a lost enquiry, not a lost position.
Which data does Google use?
Google's measurements come from the Chrome User Experience Report (CrUX). CrUX records real visits from Chrome users on desktop and on Android. It does not include Chrome on iOS, Android apps that use WebView, or other Chromium browsers such as Microsoft Edge. So the figures describe the Chrome audience, which may differ from the audience on your site.
Pages must also be publicly discoverable and popular enough to be included. A new or low-traffic page may have no field data at all, which means it is not assessed on the field metric until visits build up. In that case, the template it shares with busier pages gives the best guide to its likely result.
Which fixes move LCP, INP and CLS?
The causes below are the ones that the B2B guides on this topic describe most often. Each cause maps to one metric, so the fix is easier to choose.
LCP: loading the main content
Slow server response, oversized hero images and render-blocking scripts or stylesheets delay the largest element. Start with the image: serve a correctly sized, modern format, and make sure the browser loads the hero early. Then look at the scripts in the head of the page. Anything that blocks the first paint can often be deferred.
INP: responding to interactions
Long JavaScript tasks and heavy third-party scripts are the usual cause. Chat widgets, tag managers, A/B testing tools and personalisation scripts all compete for the browser's main thread, so a click can wait while the browser finishes other work. B2B marketing teams add these tools one at a time, so the page slows without any single change looking responsible. Audit the list of scripts, remove the ones nobody uses, and load the rest after the first interaction where possible.
CLS: keeping the layout still
Images, embeds and banners without reserved space push content down when they load. Late-loading web fonts can shift text, and consent notices that appear after the page has rendered can move the form beneath them. Set width and height on images and media, reserve space for banners and embeds, and check that cookie notices and chat widgets do not move the content a visitor is reading.
Why do B2B pages fail the field data?
The pattern is consistent across B2B sites. The homepage is usually built with the most care and tends to pass. The pages that fail are the ones added later: a blog template, a landing page for a campaign, a pricing comparison, or a case study with embedded video. Each of these pages often carries its own widgets, forms and scripts, and no one is responsible for checking them together.
Two structural causes are common on B2B sites. The first is the marketing site sharing infrastructure with the product, so that application code and tracking code load on pages that only need to display content. The second is governance: nobody owns the performance budget, so each new tool is approved on its own merits. Both causes are management problems as much as technical ones, and both are fixed by naming an owner for the templates and checking their scores after each release.
Field data or lab data?
Both have a job. Lab tools such as Lighthouse are useful for diagnosis and for checking that a fix works before release. Field data records what real visitors experienced, and it is the data Google uses to assess a page. Web.dev is direct on the point: only field measurement captures the complete picture.
| Question | Use lab data | Use field data |
|---|---|---|
| Is this fix working on a test page? | Yes | No |
| Did the release make the live page slower? | Partly | Yes |
| Does the page pass for real visitors? | No | Yes |
| Which device group is failing? | Partly | Yes |
If a lab score is high and the field data fails, trust the field data. Look for the scripts or images that only load for real visitors, such as a consent banner that appears after a delay, or a chat widget that loads only for returning visitors.
How do you prioritise the work?
Fix the templates that carry the most pipeline first, then the pages that the templates generate. A shared template fix reaches every page built from it, so it has the largest return on effort. Use three checks to rank the templates:
- Field status. Does the template fail on one or more metrics at the 75th percentile?
- Business value. Do the pages built from it attract enquiries or support a sales conversation?
- Cheapest fix. Can the problem be solved by changing an image, deferring a script or reserving space, without a rebuild?
Templates that fail on field data, carry commercial pages and have a cheap fix go first. Pages that pass already can wait. Set a performance budget for each template, so that a new script or image cannot quietly push it back into the poor range.
A simple starting test takes about ten minutes. Check three pages, the homepage, one service page and one blog post, in a field-data tool on mobile and on desktop. Note which metrics fail and which template each page uses. That list is usually enough to decide where to start.
Common mistakes
- Fixing the homepage only. The homepage often passes already, so effort there rarely changes the outcome.
- Trusting a high lab score. A good Lighthouse result on a clean test page says little about a live page with a chat widget and a consent banner.
- Treating Core Web Vitals as the whole SEO plan. The metrics are one part of page experience. Content relevance and crawlability still matter more for most pages.
- Adding scripts without a budget. Each tool looks small on its own. Together they are the most common cause of regression.
What should a B2B site track each month?
Track the three metrics at the 75th percentile for each template group, not for the homepage alone. Record the number of third-party scripts on the commercial templates, since that count tends to rise after each marketing campaign. Compare the figures with the enquiries from the same pages, so the work is judged by its commercial result as well as its technical one.
If a score drops after a release, the fastest diagnosis is usually to compare the scripts added in that release with the list from the previous month.